Every market research project should kick off with one fundamental rule: define sharp, measurable objectives before you collect a single piece of data. This isn't about setting vague goals like "understanding the market." It's about creating a focused plan that ties directly to your business needs, ensuring every dollar you spend comes back as actionable intelligence. A study by Bain & Company found that companies using data-driven insights are twice as likely to have above-average financial performance.
Setting Clear Objectives for Your B2B Research
Jumping into market research without clear objectives is like setting sail without a map. You might gather some interesting tidbits along the way, but you won't end up anywhere useful. Success hinges on knowing exactly what you need to learn and why you need to learn it.
It's no surprise that companies making data-driven decisions are not only more profitable but also 5-6% more productive than their peers. That competitive edge starts right here, with this first step.
For B2B companies in North America, this means framing your research around specific, real-world business challenges. Are you a Toronto-based SaaS company eyeing an expansion into the U.S. Midwest? Or maybe you're an American manufacturing firm trying to figure out why a competitor is stealing market share in Western Canada? Your objectives have to reflect these concrete scenarios.
Pinpoint Your Knowledge Gaps
The best way to nail down your objective is to figure out what you don’t know. Start by asking the tough questions that reveal your team’s blind spots. This simple exercise forces you to focus your efforts where they'll have the biggest impact.
Think about these common B2B situations:
- New Product Launch: "What specific pain points are our target customers in the U.S. healthcare sector actually dealing with that our new software could solve?"
- Market Expansion: "What are the top purchasing criteria for logistics managers in Vancouver, and how are they different from what drives decisions in Montreal?"
- Competitive Analysis: "Why are mid-sized tech firms in Texas picking our competitor over us, even when our price is lower?"
These questions are specific, targeted, and lead straight to insights you can actually use. They give your research a clear scope, stopping it from spiralling into a costly, never-ending exploration.
A well-defined research objective is your filter. It helps you separate the valuable signals from all the distracting noise, making sure your resources are spent answering questions that will genuinely move the needle for your business.
Leverage AI to Sharpen Your Focus
You can speed up the process of defining these objectives with a little help from artificial intelligence. B2B firms can use AI tools like Perplexity to quickly synthesize market data and spot potential knowledge gaps.
For example, you could ask it, "What are the most cited challenges for B2B marketers in the Canadian financial services industry in 2024?"
The AI will scan industry reports, articles, and forums to give you a summarized list of key issues. This preliminary analysis helps you sharpen your research questions with incredible speed, turning what used to be weeks of manual digging into just a few hours of focused inquiry. It ensures your primary research is aimed at the most relevant and pressing problems from the get-go.
With clear, intelligent objectives locked in, you’re ready to build a research plan that actually delivers results.
Ready to define objectives that will guide your growth strategy? Contact us to learn how we build research plans that deliver clarity and drive real business outcomes.
Choosing the Right Research Methods and Tools
Your research is only as good as the methods you use to get it. Once you have clear objectives nailed down, the next move is picking the right approach to find your answers. This usually comes down to a choice between collecting fresh, firsthand information (primary research) and digging into existing data (secondary research).
Both have their place, and frankly, the best strategies almost always blend them. A Canadian SaaS company, for example, might kick things off with secondary research—poring over competitor reports and market stats—to get the lay of the land. Then, they could follow up with primary research, like in-depth interviews, to uncover the specific, unspoken frustrations their target users are dealing with.
Distinguishing Primary and Secondary Research
Think of secondary research as your foundational homework. It’s all about gathering intelligence that’s already out there. This includes everything from government statistics and industry association reports to teardowns of your competitors' products. It's fast, cost-effective, and gives you that crucial big-picture view of the market.
Primary research, on the other hand, is the data you go out and collect yourself for your specific purpose. This is where you get answers to your unique questions through methods like surveys, interviews, and focus groups. A manufacturing firm in the United States, for instance, might use a large-scale quantitative survey to get a precise read on the market size for a new industrial component.
This decision tree can help you visualise which path to start on based on your core business objective—whether you’re launching a new product, cracking a new market, or just trying to get ahead of the competition.
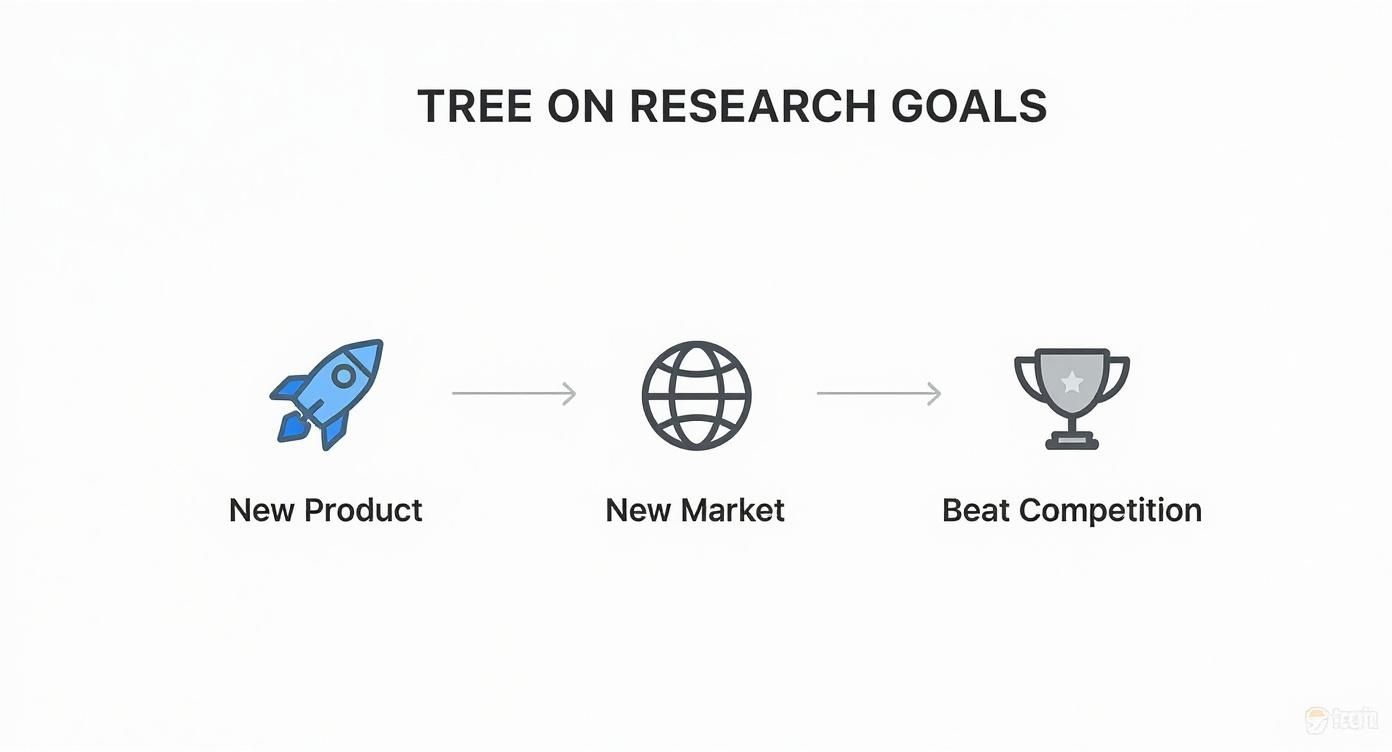
As you can see, your strategic goal directly points you toward the most effective research methodology, guiding you to the data collection techniques that will give you the most bang for your buck.
To help you decide which methods fit your goals and budget, here’s a quick comparison of the most common primary and secondary research approaches.
Primary vs Secondary Research Methods
| Method Type | Examples | Best For | Pros | Cons |
|---|---|---|---|---|
| Primary (Qualitative) | One-on-one interviews, focus groups, observational studies | Understanding motivations, feelings, and the "why" behind behaviours. | Deep, nuanced insights; flexible; uncovers unexpected findings. | Small sample sizes; not statistically representative; can be time-consuming. |
| Primary (Quantitative) | Surveys, polls, A/B tests, statistical analysis | Validating hypotheses, measuring trends, and getting hard numbers. | Statistically reliable; scalable; provides clear, measurable data points. | Can lack context; requires careful design to avoid bias; may miss nuances. |
| Secondary Research | Industry reports, government stats, competitor analysis, academic papers | Gaining a broad market overview, identifying trends, and initial fact-finding. | Fast and cost-effective; provides a solid foundation; accessible data. | Data can be outdated; not specific to your unique questions; quality can vary. |
Ultimately, the strongest research plans don't rely on just one method. They weave together the broad context from secondary data with the deep, specific insights from primary research to build a complete and actionable picture.
Choosing Your Primary Research Method
When you hit a wall and realise secondary data just can't answer your most burning questions, it's time to roll up your sleeves and do some primary research. The big decision here is whether to go qualitative or quantitative, and it all depends on what you’re trying to learn.
Qualitative Research is all about the "why." It digs deep into thoughts, feelings, and motivations through smaller, more intimate settings like one-on-one interviews or small focus groups. The cautionary tale of Kodak is a classic example of what happens when you ignore qualitative signals—they had the research confirming the shift to digital photography but failed to act on what it told them about changing customer behaviour.
Quantitative Research answers the "what" and "how many." It uses larger sample sizes through tools like surveys and polls to generate hard statistical data. This is how you take a hypothesis and see if it holds up on a larger scale.
There are many ways to gather these firsthand insights. To get a better sense of your options, check out these 8 types of market research.
The best approach often blends both. You might start with interviews (qualitative) to form a hypothesis about a customer pain point, then deploy a survey (quantitative) to see just how widespread that issue really is across your entire target market. This balanced approach ensures you have both the compelling stories and the hard numbers to back up your strategic moves.
Using AI to Accelerate Your Market Research
Let's be honest, traditional market research can be a real slog. Days, sometimes weeks, are lost to manually digging through industry reports, competitor websites, and dense academic papers. But what if you could shrink that timeline from weeks to days?
That's where artificial intelligence comes in. AI is no longer some far-off concept; it’s a practical, powerful tool that’s changing how smart B2B companies in Canada and the United States gather intelligence. This isn't about replacing human researchers—it's about giving them superpowers.
By automating the grunt work of data collection and synthesis, AI frees up your team to focus on what really matters: strategy, not spreadsheets. In fact, studies show AI can help researchers complete tasks up to twice as fast with 40% higher quality. For startups and scale-ups that need to move quickly, that kind of efficiency is a game-changer.

From Manual Drudgery to Automated Discovery
Imagine you need to map out the competitive landscape for your new SaaS product in the Canadian healthcare sector. The old way involved endless searching, copying and pasting into documents, and trying to stitch it all together into something coherent.
Tools like Perplexity completely flip that script. Instead of just searching, you can ask a direct, complex question and get a synthesized answer, complete with neat citations from the original sources. No more hunting for where you found that one killer stat.
The real power here is speed and synthesis. You can get the gist of a 50-page industry report in minutes, spot emerging market trends from thousands of articles, or analyze customer sentiment across hundreds of online reviews—all with a few smart prompts.
Crafting Effective Prompts for B2B Research
The secret to getting great answers from AI is asking great questions. Your prompts need to be specific, contextual, and action-oriented. Vague questions will always get you vague, unhelpful answers.
Let's run through a real-world scenario. Say you’re a B2B company in Waterloo, Ontario, looking to launch a new cybersecurity solution for small businesses in the United States.
Here's how you could use Perplexity to kickstart your research:
- To Nail Down Pain Points: Forget asking, "What do small businesses want?" Instead, try: "Analyze articles and forum discussions from 2024 to identify the top 5 cybersecurity challenges for US-based small businesses with under 100 employees. Cite your sources."
- To Scope Out the Competition: To figure out who you’re up against, ask: "Who are the top 3 competitors offering cybersecurity solutions to the US SMB market? For each, summarize their main value proposition, target audience, and pricing model based on their website content."
- To Form an Early Hypothesis: Use AI to connect the dots. Ask: "Based on the SMB pain points and competitor offerings you found, what are three potential gaps in the market a new cybersecurity solution could fill?"
This structured approach gives you a rock-solid foundation of secondary research in a fraction of the time.
AI doesn't just find information; it helps you build understanding. By handling the low-level data gathering, it frees up your team's brainpower to focus on what truly matters: interpreting the insights and building a winning strategy.
A Quick Story from the Trenches
A mid-sized American logistics company we know wanted to understand how supply chain trends were shifting post-pandemic. Their small research team was facing a mountain of reports, news articles, and academic papers—a project they estimated would take three months.
By turning to an AI research platform, they automated the synthesis of all that text. The AI pulled out recurring themes, highlighted key stats, and even generated summaries of the most critical documents.
The result? The team finished their initial analysis in just two weeks. They presented data-backed strategic recommendations to leadership months ahead of schedule, allowing them to pivot their services to meet new demands for localized warehousing. That gave them a huge first-mover advantage over slower competitors.
AI is an indispensable ally in the hunt for market intelligence. By integrating tools like Perplexity into your workflow, you can move faster, uncover deeper insights, and make more confident, data-driven decisions.
From Raw Data to Actionable Insights
Collecting data is only half the battle. Raw survey responses, interview transcripts, and market statistics are just noise until you give them meaning. The real value in learning how to conduct market research lies in transforming this raw information into strategic insights that can steer your business toward its next big opportunity.
This is where the hard work of analysis begins. Companies that effectively use data analytics see an average profit increase of 8-10%. The process doesn't require a Ph.D. in statistics; it starts with practical techniques for spotting patterns and connecting the dots between different data sources.

Synthesizing Quantitative and Qualitative Data
The most powerful insights emerge when you blend different types of data. Quantitative data tells you what is happening, while qualitative data explains why. Relying on one without the other gives you an incomplete, and often misleading, picture of your market.
Imagine your survey data (quantitative) shows that 65% of potential customers in the U.S. find your pricing too high. That’s a useful but incomplete fact.
Now, layer in the findings from your customer interviews (qualitative), where you repeatedly heard prospects say, "We don't see the value because it's missing a key integration with our existing software."
Suddenly, you have a much clearer picture. The problem isn't just the price tag; it's a perceived value gap. This synthesis allows you to move beyond a simple pricing discussion to a more strategic conversation about your product roadmap and feature priorities.
Practical Analysis Techniques
You don’t need sophisticated software to start your analysis. Much of the initial heavy lifting can be done with simple, accessible tools.
- Coding Interview Transcripts: Go through your interview notes and highlight recurring words, phrases, and concepts. Group these into themes—like "integration challenges," "onboarding difficulties," or "desire for better reporting." This coding process turns messy qualitative feedback into structured, analyzable themes.
- Simple Spreadsheet Functions: Use tools like Microsoft Excel or Google Sheets to analyze survey results. Functions like COUNTIF can tally responses, while pivot tables can help you segment data to see how answers differ between customer groups (e.g., small businesses in Canada vs. enterprise clients in the U.S.).
The goal of data analysis isn't just to report numbers. It's to build a narrative that explains what the data means for your business, uncovering the story hidden within the patterns and outliers.
A great example of this in action is Netflix. By meticulously analyzing viewing data (what people watch, when they pause, what they abandon), they identified a clear pattern of user preference for binge-watching. This quantitative insight led to their groundbreaking decision to release entire seasons at once, a move that completely disrupted traditional television and fueled their global dominance.
Identifying Patterns and Outliers
As you analyze, you're looking for two things: patterns that reveal common truths and outliers that signal unique opportunities or risks. Patterns might show that a specific pain point is shared across your entire target market, validating a product feature.
An outlier, however, could be a single customer using your product in a completely unexpected way. While easy to dismiss, this could be the first sign of an entirely new use case or an untapped market segment.
Don't ignore the exceptions; they are often where the most valuable and disruptive insights are found. For more guidance on presenting these findings, explore our digital marketing report for templates and best practices.
Turning raw data into a coherent strategy is a critical skill. Need help finding the story in your data? Contact us to learn how our expert analysis can uncover the insights you need to drive growth.
Turning Your Research Into Winning Strategy
Let's be honest: the true test of your market research isn't a slick report or a mountain of data. It’s the quality of the decisions it sparks. All that hard work is wasted if your findings just sit on a server, collecting digital dust.
This final leg of the journey is all about closing the gap between insight and action. It’s where you translate numbers and quotes into a compelling story that gets everyone—from the C-suite to the product team—nodding in agreement and ready to move. Great research should make your next steps feel almost obvious.
Building Detailed Buyer Personas
One of the best ways to make your research tangible is to build out detailed buyer personas. These aren’t just generic profiles; they’re semi-fictional characters constructed from the real qualitative and quantitative data you just collected. They are the living embodiment of your ideal customer.
Give each persona a name, a job title, and the specific goals and pain points you uncovered in your interviews. For instance, a Canadian software company might create "IT Manager Ian" from Vancouver. He’s struggling with data security compliance and needs a solution that’s powerful but still easy for his non-technical team to use.
Suddenly, abstract data points become a relatable human story. This makes it infinitely easier for your marketing and product teams to align on who they’re building for and how to talk to them.
Refining Your Value Proposition
Your research findings should either validate your existing value proposition or challenge you to rethink it entirely. Did you find out that a feature you thought was a game-changer barely got a mention? Or did a completely unexpected pain point crop up in interview after interview?
Use these insights to sharpen your messaging. A US-based logistics company I worked with is a perfect example. They discovered their enterprise clients cared less about speed and more about predictability and clear communication. They pivoted their entire marketing angle from "fastest delivery" to "the most reliable delivery partner." The change directly addressed the market's real needs and gave their enterprise sales a significant boost.
Your research findings are the voice of your market. A winning strategy is simply one that listens carefully to that voice and responds with a clear, compelling value proposition that solves a real problem better than anyone else.
Translating Insights Into a Product Roadmap
A data-driven product roadmap strips the guesswork out of development. When you combine qualitative feedback on feature gaps with quantitative data on market demand, you can prioritize what to build next with genuine confidence.
- High-Impact Features: Pinpoint the features that solve the most painful problems for your most valuable customer segments.
- Competitive Gaps: Identify the weak spots in your competitors' offerings where you can build a superior solution and win.
- New Opportunities: Keep an eye out for outlier data that could signal an emerging need or even an entirely new market to explore.
This process ensures your precious development resources are aimed squarely at building things people will actually pay for. For B2B companies, this strategic alignment is the key to sustainable growth and a core part of building a successful go-to-market strategy.
A classic success story is Slack. Originally an internal tool for a gaming company, their own user data showed its immense potential for team communication. They pivoted their entire business based on this internal "market research," and the result was a product that redefined the B2B collaboration space and reached a valuation of over $20 billion.
Turning insights into tangible growth is the ultimate goal of any research project. The frameworks above will help you make your research impossible for stakeholders to ignore. Ready to get started? Contact us now.
Your B2B Market Research Questions, Answered
As you gear up to launch a market research project, it's totally normal for questions to bubble up. The process can feel a bit overwhelming, but getting straight answers to the common sticking points will give you the confidence to keep things moving. Here are some of the most frequent questions we hear from B2B companies in the United States and Canada.
How Much Should a B2B Company Budget for Market Research?
There’s no single price tag—the cost is tied directly to your scope and the methods you choose. A tight, focused secondary research project using existing data and reports might only set you back a few thousand dollars. For startups and scale-ups in Canada or the United States, this is a fantastic starting point for building foundational insights.
On the other hand, a comprehensive primary research study, complete with dozens of in-depth interviews and a large-scale survey, can run anywhere from $15,000 to over $50,000. The trick is to define your objectives first, then find a methodology that fits your budget—not the other way around.
What Is the Biggest Mistake Companies Make in Market Research?
The most common and costly error is confirmation bias. It’s when you start with an answer you want to be true and then hunt for data to support it. A major North American retailer once famously ignored its own research showing customers wanted smaller, more convenient stores because the leadership team was already committed to a big-box expansion. That strategic blunder cost them billions.
True market research is an act of discovery, not validation. The goal is to uncover the truth, even if it shatters your most cherished assumptions. You have to frame your questions neutrally and be ready to hear things you don't want to hear.
How Can B2B Companies Use AI Tools to Help?
Artificial intelligence tools like Perplexity are brilliant for speeding up the early stages of research. Instead of your team spending weeks manually combing through industry reports, you can use AI to synthesize huge amounts of information in minutes.
For instance, a tech firm in Waterloo, Ontario, could ask Perplexity, "What are the primary adoption barriers for AI in the US manufacturing sector?" and get a summarized, sourced answer almost instantly. This frees up your team to form hypotheses quickly and focus primary research on digging into the deeper, more strategic questions.
How Can I Conduct Research Without Direct Customer Access?
If you can't get direct time with customers, don't worry. You can shift your focus to high-quality secondary sources that offer powerful, indirect feedback. This approach can be surprisingly effective.
- Pick apart competitor case studies. They often spell out the exact pain points and results that customers find valuable.
- Dig into G2 or Capterra reviews. Scour reviews in your industry to get a real feel for user sentiment, feature requests, and common frustrations.
- Listen in on LinkedIn Groups and online forums. Eavesdrop on conversations where your target audience is openly discussing their day-to-day challenges and needs.
- Read industry analyst reports. Firms like Gartner and Forrester do the heavy lifting for you, providing deep dives into market trends and customer priorities.
How Long Does a Typical B2B Market Research Project Take?
The timeline really depends on the complexity. A streamlined project that leans heavily on AI tools and secondary data can deliver actionable insights in as little as 2-4 weeks. This kind of rapid turnaround is perfect for fast-moving startups.
In contrast, a more intricate project—especially one where you need to schedule and conduct dozens of interviews with busy executives across North America—can easily stretch to 2-3 months. It's crucial to set a realistic timeline based on your methods to keep your stakeholders' expectations in check.
Understanding how to conduct market research is the first step toward making smarter, data-driven decisions. But turning that data into a winning strategy takes expertise. B2Better acts as your Fractional CMO partner, translating insights into measurable growth.
Ready to build a strategy that gets results? Contact us today to get started.