Digital marketing reporting is simply the process of tracking, analyzing, and sharing the key performance indicators (KPIs) from your marketing campaigns. It's how you turn a mountain of raw data from all your different channels into actionable insights that tell you what’s working, what isn’t, and—most importantly—why. This is absolutely critical for fine-tuning your strategy and proving marketing's return on investment (ROI). In fact, marketers who consistently measure ROI are 1.6 times more likely to receive higher budgets.
Why Digital Marketing Reporting Is Your Growth Compass

Imagine you're trying to sail a ship across the ocean with no map, compass, or GPS. Sure, you might be moving, but you have no clue if you're heading toward your destination or sailing straight into a storm. That’s exactly what running marketing campaigns without solid reporting feels like—a high-stakes guessing game.
Reporting isn’t about collecting numbers just for the sake of it. It’s the strategic tool that translates all your hard work into clear business intelligence. Think of it as your company's navigation system, helping you steer away from wasted ad spend and toward the high-performing channels that deliver real results, a critical factor for success in the competitive United States and Canadian markets.
Moving From Data Collection To Insightful Analysis
A lot of businesses get stuck in the data collection phase, cranking out reports filled with metrics that have no context or clear path forward. The real power of reporting comes when you move beyond simple data points to uncover the "why" behind your performance. This is where growth truly happens.
For instance, knowing you got 1,000 website visits is just data. But knowing that 75% of those visits came from a single blog post in Canada and converted at a 5% rate—now that's an insight. This distinction is vital for businesses in the United States and Canada, where long B2B sales cycles demand a clear view of every single customer touchpoint.
By analyzing vast amounts of consumer data, predictive models allow marketers to forecast future events, analyze consumer behaviour, and inform campaigns and strategies to stay ahead of the competition.
The Tangible Benefits Of Strong Reporting
When done right, reporting gives you a clear, objective view of what’s actually driving your business forward. It puts an end to debates based on gut feelings and replaces them with decisions backed by hard data. This clarity is essential for aligning your marketing team with the company's bigger goals.
- Optimized Budget Allocation: Stop pouring money into campaigns that don't perform. Reporting pinpoints your most profitable channels, letting you reallocate your budget for maximum ROI. Businesses often see a 10-20% improvement in marketing efficiency just by putting a consistent reporting structure in place.
- Enhanced Strategic Decisions: You’ll finally understand which content resonates, which ad copy converts, and which social platforms truly engage your target audience. A great example is a North American SaaS company that used detailed reporting to discover their LinkedIn ads blew all other channels out of the water. They doubled down and increased their MQLs by 40% in a single quarter.
- Improved Accountability and Alignment: When everyone from the marketing manager to the CEO is looking at the same data, it creates a unified vision. It proves the value of marketing activities and connects them directly to revenue goals, ending the "what is marketing even doing?" conversations for good.
Ultimately, digital marketing reporting is the backbone of any successful growth strategy. It delivers the clarity and direction needed to make smarter, faster decisions.
If you're ready to transform your data from a confusing spreadsheet into a strategic growth compass, our team can help. Contact us today to learn how our Fractional CMO services can build a reporting engine that fuels sustainable growth.
Choosing KPIs That Actually Drive Business Results
In digital marketing, it's incredibly easy to get lost in a sea of numbers. Likes, shares, impressions, website visits—they all feel good, but do they actually move the needle for your business? The trick is to stop chasing these often-misleading vanity metrics and start focusing on Key Performance Indicators (KPIs) that directly tie back to business impact.
Think of it like this: tracking 'likes' on a social media post is like counting how many people admired your storefront window display. It's nice to know, but it doesn't tell you if anyone actually came inside and bought something. A true KPI, like 'lead conversion rate from social,' tells you exactly how many of those window shoppers turned into paying customers. That distinction is everything for B2B firms in the United States and Canada aiming for sustainable growth.
Let’s be honest: if a metric doesn’t help you understand how you’re making money, it’s probably just a distraction.
We need to connect every single marketing activity to a revenue-generating outcome. To do that, we have to pick the right KPIs for each channel.
We've put together a quick-reference table outlining the essential KPIs you should be tracking across your core digital marketing channels. These aren't just numbers to fill a report; they're the vital signs of your marketing health, telling you what's working, what's not, and where to invest your next dollar for the best return.
Essential KPIs by Digital Marketing Channel
| Channel | Primary KPI | Secondary KPI | Why It Matters |
|---|---|---|---|
| SEO | MQLs from Organic Search | Keyword Rankings for High-Intent Terms | Tracks how many sales-ready leads your SEO efforts are generating, moving beyond simple traffic to measure true business impact. |
| Paid Media | Customer Acquisition Cost (CAC) | Return on Ad Spend (ROAS) | Measures the total cost to acquire a new customer, ensuring your ad spend is efficient and scalable. |
| Email Marketing | Lead-to-Customer Conversion Rate | Click-Through Rate (CTR) on Nurture Emails | Shows the percentage of nurtured leads that become paying customers, proving the value of your email funnel. |
| Social Media | Demo Requests from Social | Engagement Rate on High-Value Content | Directly links social media activity to sales pipeline growth, focusing on actions that lead to revenue instead of just likes. |
| Content Marketing | Content-Attributed Leads/Pipeline | Average Time on Page for Key Assets | Quantifies how many leads and how much pipeline value can be traced back to a specific piece of content, proving its ROI. |
By focusing on these primary and secondary KPIs, your reporting transforms from a simple activity log into a strategic tool that guides decisions and fuels real, measurable growth.
SEO and Paid Media KPIs
When it comes to search, the goal isn't just to get clicks; it’s to attract high-intent traffic that turns into business. For Search Engine Optimization (SEO), that means looking beyond vanity metrics like keyword rankings for broad terms. Instead, you need to concentrate on metrics that prove the quality and commercial value of your organic traffic.
For paid media campaigns on platforms like Google Ads or LinkedIn, every dollar has to be accountable. Your reporting should draw a straight line from ad spend to revenue, proving you’re acquiring valuable customers, not just buying clicks.
Here are the non-negotiables:
-
Customer Acquisition Cost (CAC): This is the big one. It’s the total sales and marketing cost required to land one new customer. A low, stable CAC is a clear sign of an efficient and healthy marketing engine. Need to get a handle on this metric? Check out our detailed guide on how to calculate customer acquisition cost.
-
Return On Ad Spend (ROAS): For every dollar you put into advertising, how much revenue comes back out? A 4:1 ROAS, for example, means you're making $4 for every $1 spent. It’s the clearest indicator of a profitable campaign.
-
Conversion Rate by Channel: This metric breaks down the percentage of visitors from a specific source (like organic search or paid social) who take a desired action, like filling out a form. It’s critical for identifying which of your channels are actually pulling their weight.
Email and Social Media KPIs
Email and social media are fantastic for building relationships, but their success isn’t measured by audience size. A massive email list that never opens anything or a huge social following that never converts is just a number on a page. It's all about engagement that leads to real business outcomes.
For email, you have to look past open rates and see what happens after the click. For social media, the focus needs to be on how your content influences behaviour off the platform. One of our B2B tech clients in Toronto, for instance, shifted their primary social KPI from 'engagement rate' to 'demo requests from social.' This simple change forced them to rethink their content strategy on LinkedIn, resulting in a 35% increase in qualified leads in a single quarter.
Content Marketing and Business Impact KPIs
Content is the fuel for almost every other channel, from SEO to social. Its effectiveness isn’t measured by how much you produce, but by its ability to attract, engage, and ultimately convert your ideal customer. Your reporting should tell a clear story, tracing the journey from a blog post view all the way to a closed deal.
When you get this right, the results can be staggering. Recent data shows that companies with strong content marketing see conversion rates nearly 6 times higher than those without. It’s becoming a powerful, data-driven discipline.
To tie everything together and report up to the C-suite, you need to focus on the high-level KPIs that speak directly to the health of the business:
-
Customer Lifetime Value (CLV): This metric predicts the total net profit you’ll make from any given customer. When CLV is rising, it means you're not just acquiring customers, you're acquiring and keeping the right ones.
-
Lead-to-Customer Conversion Rate: Of all the leads marketing generates, what percentage actually becomes a paying customer? This is a crucial measure of sales and marketing alignment and the overall health of your funnel.
By choosing KPIs that reflect actual business performance, your digital marketing reporting stops being a chore and becomes your most powerful strategic tool for driving growth.
Ready to build a reporting dashboard that focuses on what truly matters? Contact us today, and our Fractional CMO experts will help you identify and track the KPIs that will drive your business forward.
Building Your Actionable Reporting Framework
A polished digital marketing report looks impressive, but if it doesn't lead to smarter decisions, it's just a collection of colourful charts. Data without action is simply noise. To make your reporting count, you need to build a framework that turns it from a passive activity into a strategic process that actively drives growth.
This framework really comes down to three things: reporting cadence, audience customization, and clear ownership.
Getting these elements right is the difference between a report that gets filed away and one that becomes the centrepiece of your strategy meetings. Companies that nail their reporting framework are far better equipped to pivot quickly and put resources where they'll have the most impact. In fact, organizations that make data-driven decisions are 23 times more likely to acquire customers and 6 times as likely to retain them in competitive United States and Canadian markets.
Setting The Right Reporting Cadence
The first pillar is figuring out how often you need to report. There’s no single right answer here; the best frequency depends entirely on the metrics you’re tracking and who’s reading the report. A mismatch can lead to either micromanaging tiny fluctuations or missing major opportunities.
- Daily Check-ins: This is for the fast-moving stuff, like a product launch or a flash sale. This frequency is for the hands-on campaign manager who’s tracking metrics like ad spend, click-through rates, and real-time conversions to make quick adjustments on the fly.
- Weekly Summaries: This is the workhorse for most marketing teams. A weekly report is perfect for tracking progress against monthly goals, analyzing how different channels are performing (think organic traffic vs. paid), and spotting trends before they become big problems.
- Monthly Reviews: This is where you zoom out for a higher-level strategic analysis. This report connects marketing activities to actual business outcomes, focusing on big-picture KPIs like Customer Acquisition Cost (CAC), lead-to-customer conversion rates, and overall marketing ROI for the leadership team.
This simple hierarchy shows how your high-level business goals are directly supported by the core KPIs you should be tracking.
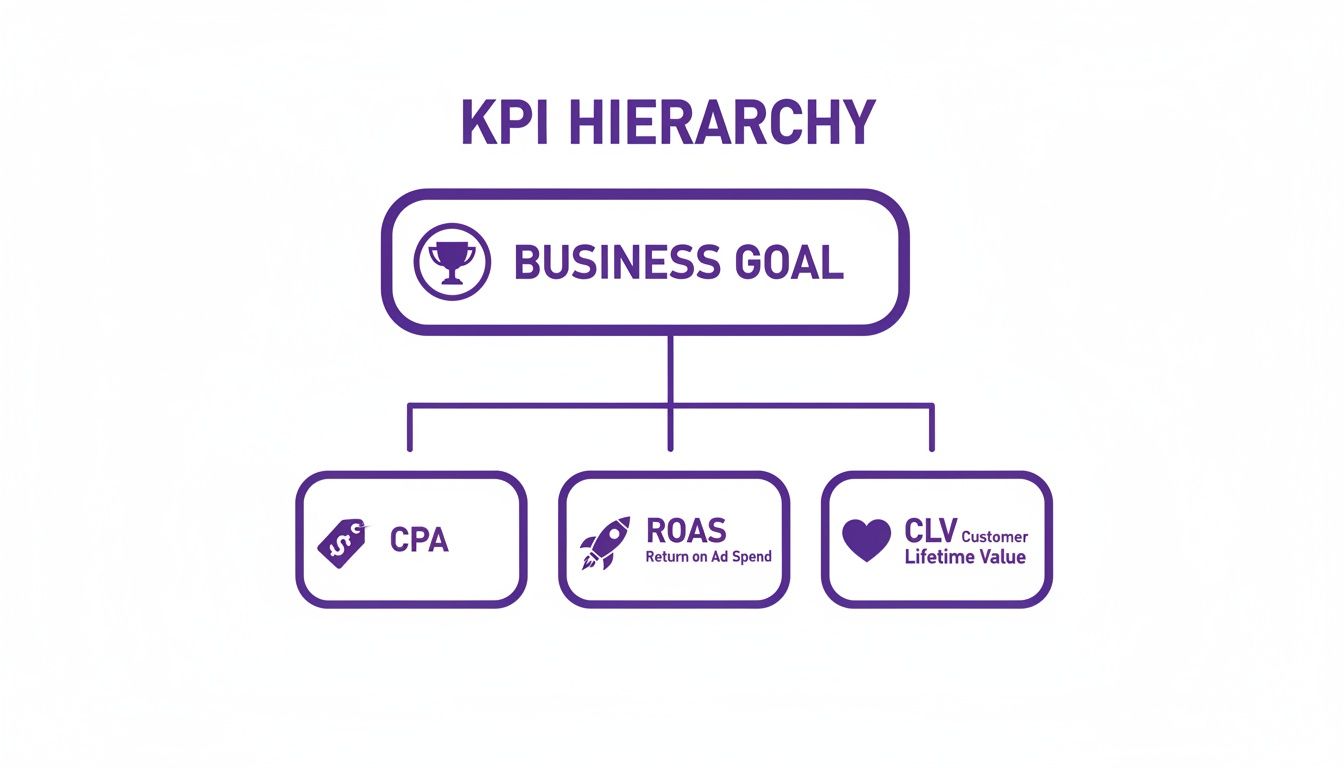
As you can see, hitting that main business goal depends on consistently optimizing the key financial metrics that directly feed your bottom line.
Tailoring Reports To The Audience
A report that’s perfect for your marketing manager will be completely useless to your CEO. The second pillar is all about customizing the content and complexity of your digital marketing reporting for its specific audience. Every stakeholder has different questions, and your report needs to give them the right answers, fast.
For instance, the Canadian-based B2B tech company Vidyard saw incredible success by tailoring its content and reporting. By understanding exactly what their audience in the United States and Canada needed at each stage, they were able to grow their pipeline significantly—a powerful example of audience-specific data in action.
A report should tell a story. For the C-suite, it’s a story about revenue and growth. For the marketing team, it’s a story about campaign performance and optimization opportunities.
Let's look at two very different templates.
C-Suite Executive Summary (Monthly)
- Focus: High-level business impact.
- Key Metrics: Total Marketing-Sourced Revenue, CAC, Customer Lifetime Value (CLV), Marketing ROI.
- Narrative: This should be a one-page visual dashboard with crystal-clear takeaways. Think: "Our marketing investment of $X generated $Y in new pipeline, achieving a Z:1 ROI."
Marketing Manager Deep Dive (Weekly)
- Focus: Granular campaign performance and channel health.
- Key Metrics: MQLs by Channel, Conversion Rates, Cost Per Lead, Keyword Ranking Changes, Email CTR.
- Narrative: This is a detailed breakdown of what worked, what didn't, and what actions the team will take next week to improve performance.
Establishing Clear Ownership
The final pillar is accountability. A reporting process without clear ownership is doomed to fail. Someone needs to be responsible for each step, from pulling the raw numbers to presenting the final insights. This is the only way to ensure consistency, accuracy, and, most importantly, follow-through.
This structure prevents crucial data from falling through the cracks and ensures that insights actually get translated into concrete actions. To dig deeper into turning data into strategy, explore our guide on understanding digital marketing analytics.
When you assign clear ownership, reporting transforms from a reactive chore into a proactive, strategic function that consistently drives your business forward.
Ready to build a reporting framework that turns your data into a decisive advantage? Contact us today to see how our Fractional CMOs can implement a process that delivers clarity and drives measurable results.
How Great Reporting Drives Real-World Success
Theory and KPIs are one thing, but the true power of digital marketing reporting snaps into focus when you see it in action. It’s not just a collection of charts and numbers; it’s a powerful engine for revenue growth and a clear map for what to do next.
When your data is meticulously tracked and tied to clear business objectives, it stops being a simple record-keeping task and becomes a serious competitive advantage. This is especially true for businesses duking it out in competitive markets like the United States and Canada, where knowing exactly what’s working is the key to grabbing a larger market share.
From Data Points to Market Dominance
Let's look at a powerful success story that brings these ideas to life: the California Avocado Commission (CAC). They didn't just track basic website metrics; they built a comprehensive reporting system that pulled together consumer behaviour and retail sales data to sharpen their entire marketing strategy for the crucial US market.
By tracking specific KPIs like shipment volumes, promotional impact, and pricing trends, the CAC could make incredibly informed decisions. Their reporting wasn't just a backward-glancing summary; it was a forward-looking tool that helped them spot opportunities and fine-tune their promotional campaigns with precision.
A great report doesn't just show you what happened; it shows you why it happened and what you should do about it. It’s the bridge between marketing effort and business outcome.
This detailed approach gave the CAC the hard evidence they needed to prove exactly how and why their avocados were outperforming imports, allowing them to double down on winning strategies and allocate their resources effectively.
A Blueprint for Success in Action
The results of the CAC’s data-driven strategy were astounding. Their Market Analysis Report, which blended Circana retail data with National Consumer Panel insights, gave them a complete picture of their performance. This comprehensive tracking allowed them to optimize their promotional efforts, which helped the state’s avocado crop hit 363.6 million pounds—a staggering 56% increase from the previous year and the largest crop in four years.
This data-backed reporting also powered 77% of incremental retail dollars and 54% of incremental units in California, proving just how much California avocados outperform imports. You can read the full story of how they used data to optimize their marketing strategies.
This case study is a powerful blueprint for any business. It proves that by connecting the right KPIs to clear business objectives, data transforms into a potent tool for growth. It’s about moving beyond surface-level metrics to really understand the nitty-gritty of consumer behaviour and market dynamics.
Ready to turn your data into a success story? Contact us today to discover how our Fractional CMO services can build a digital marketing reporting system that drives real, measurable results for your business.
The Best Tools to Automate Your Reporting

Let's be honest: nobody loves manually pulling data from a dozen different platforms and wrestling it into a spreadsheet. It’s a massive time drain, and by the time you’re done, the data is already old.
Modern, efficient reporting runs on automation. It’s about building a reporting engine that frees your team from tedious data entry so they can focus on what really matters: strategy and analysis. The right tools deliver the insights you need, right when you need them.
And it’s not just a nice-to-have anymore. A recent study found that 76% of companies that automate marketing see a positive ROI within a year. It’s a necessity for staying competitive in fast-paced North American markets.
Core Automation and Visualization Tools
The foundation of any automated reporting system is connecting all your scattered data sources into a single, cohesive dashboard. This gives you a live, self-updating view of your performance without ever having to copy and paste another number.
- Google Analytics 4 (GA4): Think of this as the central nervous system for your website. It tracks user behaviour, conversions, and traffic sources, providing the raw data for your most important KPIs.
- Looker Studio (formerly Google Data Studio): This is where the magic happens. Looker Studio is a free and surprisingly powerful tool that connects to GA4, Google Ads, social media platforms, and more. It pulls everything together into interactive, shareable dashboards that automatically refresh.
Here's a peek at the Looker Studio interface, where you can build custom, real-time reports from multiple data sources.
Dashboards like this transform complex data into clear, actionable charts and graphs, making it easy for any stakeholder to understand what’s going on at a glance.
Advanced Automation with Integrated Platforms
Beyond basic dashboards, integrated platforms like HubSpot offer a more complete solution. These tools centralize your marketing, sales, and service data, giving you a single source of truth for the entire customer journey.
The goal of automation is to eliminate manual tasks, not strategic thinking. A great tool doesn't just show you the data; it gives you back the time to interpret it.
For instance, HubSpot's reporting tools can automatically attribute revenue back to a specific blog post or social media campaign. This provides a clear ROI without any manual calculations, which is exactly what you need to prove marketing’s value. Exploring the top ten B2B marketing tech stack tools can help you figure out which platforms are the best fit for your specific needs.
Building an automated reporting system can seem daunting, but it’s one of the highest-impact activities a marketing team can undertake. It gives you the clarity and efficiency needed to make smarter, faster decisions.
Turn Your Data Into a Competitive Advantage
You now have the complete blueprint for turning raw data into decisive action. We’ve walked through the strategic nuts and bolts of digital marketing reporting, from tracking the right KPIs for each channel to building a structured, audience-aware framework. This is the foundation of a modern, data-driven marketing engine.
But for many B2B companies across Canada and the United States, there’s a gap between knowing and doing. They understand the "what" and "why," but they just don't have the time or specialized in-house expertise to build a truly world-class reporting system that consistently delivers game-changing insights.
Bridging the Gap Between Data and Decisions
This is where expert guidance makes all the difference. An experienced Fractional CMO can step in to design a custom reporting strategy from the ground up, build sophisticated automated dashboards, and provide the crucial executive-level analysis that connects your marketing activities directly to revenue.
Success isn't just about having data; it's about knowing how to read the story it’s telling. A North American tech firm we worked with is a perfect example. Expert analysis revealed its lead-to-customer conversion rate from content marketing was 2x higher than any other channel. By reallocating resources based on that single insight, they boosted their overall marketing ROI by 30% within six months.
Businesses that leverage marketing analytics see an average profit increase of 15-20%. This just goes to show the incredible value of having an expert interpret your reporting.
Without the right leadership, even the best data can lead to confusion and inaction. A Fractional CMO provides the strategic oversight to ensure your reporting doesn't just collect dust. They make sure it actively fuels your growth strategy and proves the undeniable value of your marketing investment.
If you're ready to stop guessing and start knowing exactly what drives your business forward, it's time for a conversation.
Contact us today to learn how our Fractional CMO services can build a powerful digital marketing reporting engine that proves ROI and fuels sustainable growth.
Your Marketing Reporting Questions, Answered
Got questions about building and using digital marketing reports? We’ve got clear, straightforward answers to help you cut through the noise and implement a powerful reporting strategy.
What's the Best Frequency for Digital Marketing Reporting?
Honestly, it depends on who’s looking at the report. Your campaign managers, the ones in the trenches with ad spend and conversion rates, will want a look daily or weekly to make quick adjustments.
Marketing teams often find a weekly report hits the sweet spot for tracking progress against monthly KPIs. For the C-suite, a monthly or quarterly report is perfect. They want the big picture—high-level metrics like Customer Acquisition Cost (CAC) and overall marketing ROI, not the day-to-day weeds.
How Can I Make Reports Easy for Non-Marketers to Understand?
Tell a story, don’t just dump data. A wall of numbers means nothing to your sales director or CEO. You need to translate metrics into real business outcomes.
For example, instead of saying "our organic traffic increased by 20%," frame it like this: "Our SEO efforts drove 20% more potential customers to our website, leading to a 15% lift in demo requests." Use visual dashboards and stick to a handful of core KPIs that tie directly to revenue.
Which Reporting Tools Are Best for a Small Business?
For most businesses in the United States and Canada, the combination of Google Analytics 4 and Looker Studio is the perfect place to start. They're free, powerful, and let you build automated, shareable dashboards to get a handle on website traffic and user behaviour.
As your business grows, you might look at platforms like HubSpot that offer more integrated reporting across both sales and marketing.
A recent study found that businesses that leverage data-driven personalization in their marketing see 5 to 8 times the ROI on their marketing spend. This just goes to show the incredible financial impact that comes from accurately reporting on and optimizing your marketing channels.
That kind of success is precisely why solid digital marketing reporting is so critical. It shows you which efforts are hitting it out of the park and which are falling flat, so you can put your budget where it will actually make a difference.
Ready to stop guessing and start making data-driven decisions that fuel real growth? B2Better can help. Our Fractional CMOs build custom reporting systems that give you the clarity you need to prove ROI and scale your business.
Contact us today to build a reporting engine that drives results.